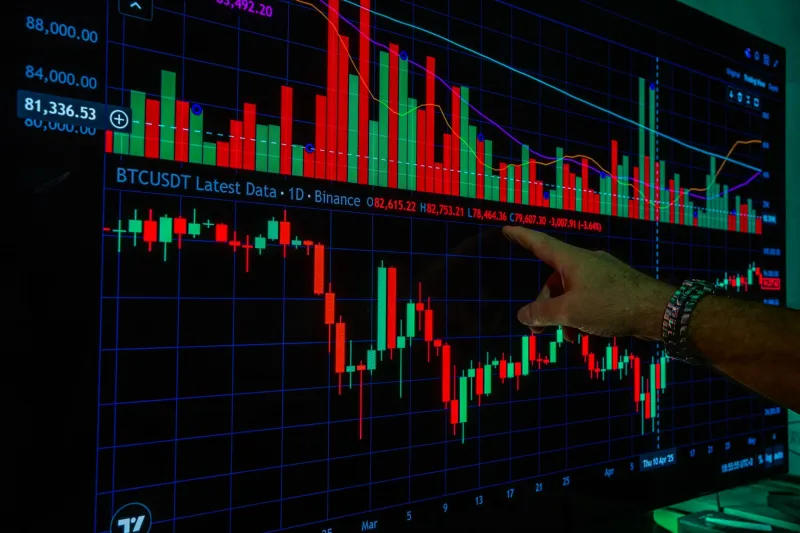
Finding the Floor: A Data-Driven Framework for Timing Bitcoin's Bear Market Bottom
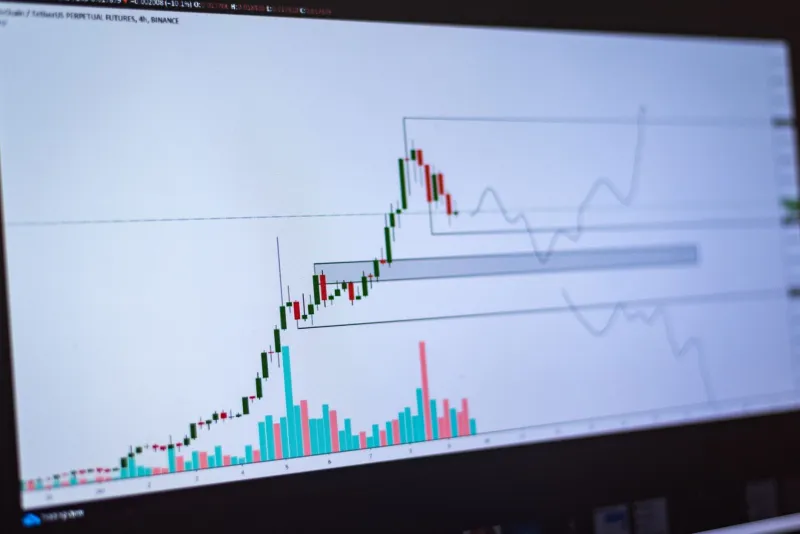
No tool in the digital asset investor's kit generates more misplaced confidence than a price chart with a hand-drawn line projecting the bottom. The cryptocurrency market is littered with the financial consequences of bottom-calling — investors who deployed capital at what they believed was maximum pessimism, only to watch prices fall another forty percent. Conversely, the market is equally littered with the opportunity cost of excessive caution: investors who waited for certainty that never arrived and missed the majority of a recovery cycle.
The solution is not a crystal ball. It is a structured, repeatable framework built on historical pattern analysis — one that replaces conviction with probability and replaces timing precision with range identification. That is what this analysis offers.
The Architecture of Bitcoin's Bear Cycles
Bitcoin has experienced four distinct major bear markets since achieving meaningful price discovery: the 2011 correction, the 2013–2015 cycle, the 2017–2018 collapse, and the 2021–2022 drawdown. Each of these events was unique in its triggers and market context, but each shared structural characteristics that allow for meaningful cross-cycle comparison.
The peak-to-trough drawdown figures across these cycles are instructive. The 2011 collapse registered approximately 93 percent from peak to trough. The 2013–2015 cycle produced a drawdown of roughly 86 percent. The 2017–2018 bear market saw a 84 percent decline. The 2021–2022 cycle, occurring in a substantially more mature market with significantly greater institutional participation, produced a drawdown of approximately 77 percent.
Two observations emerge immediately. First, the severity of drawdowns has been declining incrementally as the market matures and the investor base broadens. Second, even the most recent cycle — occurring in a market with publicly traded Bitcoin ETF products, institutional treasury allocations, and regulated futures markets — produced a drawdown that would be considered catastrophic in virtually any other asset class.
For investors attempting to identify a floor, the implication is straightforward: historical precedent suggests that drawdowns exceeding 70 percent from a confirmed cycle peak have consistently represented structurally significant entry zones across Bitcoin's history, with the caveat that the precise bottom within that zone has never been identifiable in real time.
Duration Patterns and the Recovery Timeline
Drawdown magnitude tells only half the story. The temporal dimension — how long bear markets persist before recovery begins — is equally important for constructing a practical entry framework.
The 2011 correction was brief by subsequent standards, lasting approximately five months from peak to trough. The 2013–2015 cycle extended for roughly 410 days. The 2017–2018 bear market ran approximately 364 days from peak to trough. The 2021–2022 cycle, measured from the November 2021 peak to the November 2022 low, lasted approximately 365 days.
A pattern of convergence is visible in the more recent cycles: bear markets appear to be stabilizing around the twelve-month duration range. This is not a mechanical rule — it is a probabilistic observation. But it has meaningful implications for investors attempting to calibrate their accumulation timelines. An investor who begins deploying capital systematically at the twelve-month mark following a confirmed cycle peak is not predicting a bottom; they are aligning their activity with a historically recurring structural window.
On-Chain Signals That Have Historically Accompanied Cycle Lows
Price and time alone are insufficient as bottom indicators. The most reliable historical signals have come from on-chain behavioral data — specifically, the patterns of long-term holder accumulation and miner capitulation that tend to coincide with genuine cycle floors.
The MVRV Z-Score. The Market Value to Realized Value Z-Score measures the relationship between Bitcoin's current market capitalization and the aggregate cost basis of all coins in circulation, expressed as standard deviations from the historical mean. Across all four major bear cycles, periods where this metric entered negative territory — indicating that the average holder was underwater relative to their acquisition cost — have corresponded closely with cycle lows. The 2022 bottom registered a negative MVRV Z-Score for an extended period before recovery began.
Long-Term Holder Supply Behavior. On-chain analytics platforms track the behavior of wallets that have held Bitcoin for more than 155 days — a cohort classified as long-term holders and generally considered to represent conviction-based ownership rather than speculative activity. At each major cycle bottom, this cohort has expanded its holdings dramatically, absorbing supply from capitulating short-term holders. When long-term holder supply reaches historic highs while price remains depressed, the structural setup for recovery has historically been present.
Miner Revenue Compression. Bitcoin miners represent a significant source of consistent sell pressure, as they must liquidate a portion of block rewards to cover operational costs. During bear markets, as price falls below the cost of production for less efficient miners, a phenomenon called miner capitulation occurs — hash rate drops, weaker operations shut down, and the remaining miners collectively sell accumulated reserves. This event has historically preceded price recovery within weeks to months, as the supply pressure from distressed miners is removed from the market.
Constructing a Probabilistic Entry Framework
The practical application of this analysis is not a single entry point — it is a structured accumulation range. For US investors managing taxable accounts, this distinction carries particular importance, as dollar-cost averaging across multiple purchase dates creates a blended cost basis that reduces both entry-timing risk and tax concentration.
A framework grounded in the data above might be structured as follows. When Bitcoin has declined more than 70 percent from a confirmed cycle high and has been in a sustained drawdown for more than nine months, the historical probability of being within the bottom quartile of the bear cycle is substantially elevated. This does not mean the bottom has been reached — it means the risk/reward profile of systematic accumulation has shifted favorably relative to the broader cycle.
Within that range, on-chain signals provide refinement. A negative MVRV Z-Score, coinciding with a measurable increase in long-term holder supply and evidence of miner capitulation, has historically represented the highest-conviction accumulation window across Bitcoin's cycles.
The Limits of Pattern Recognition
Any honest analysis of Bitcoin's cycle patterns must acknowledge the possibility of structural breaks. Each cycle has occurred in a fundamentally different regulatory, macroeconomic, and institutional context. The 2025 and 2026 environment — shaped by spot ETF inflows, potential sovereign adoption, and evolving Federal Reserve policy — may produce dynamics that diverge from historical norms.
The value of this framework is not that it guarantees accuracy. It is that it replaces emotionally driven decision-making with a repeatable, evidence-grounded process. Investors who approach the next bear market with defined criteria for accumulation — rather than waiting for a certainty that markets never provide — are better positioned to capitalize on the recovery phase that Bitcoin's history suggests will follow.