Phantom Depth: How to Expose the Hidden Liquidity Crisis Lurking in Your Crypto Portfolio
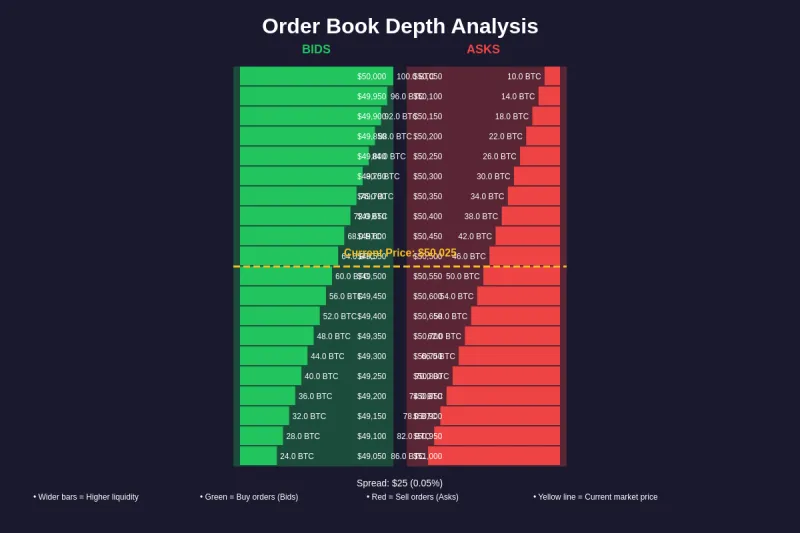
Photo: cryptocurrency order book trading screen depth chart analysis, via res.cloudinary.com
Volume figures are among the most prominently displayed statistics across every major cryptocurrency data platform. Billions of dollars in daily trading volume are cited as evidence of healthy, accessible markets. Yet when volatility spikes or a large position needs to be unwound, many investors discover a sobering reality: the liquidity they believed existed was never truly there.
This is not a fringe concern. It is one of the most structurally underappreciated risks in the digital asset space, and it disproportionately harms investors who rely on surface-level metrics when building or liquidating positions.
The Volume Illusion: What the Numbers Are Really Telling You
Trading volume, as reported on aggregators like CoinMarketCap or CoinGecko, is a lagging and frequently manipulated metric. Wash trading — the practice of simultaneously buying and selling an asset to artificially inflate volume statistics — remains endemic across many smaller and mid-tier exchanges. Academic research and on-chain forensics have consistently identified that a meaningful portion of reported spot volume on unregulated venues is synthetic.
Even on regulated, reputable exchanges, volume figures reflect completed transactions rather than the capacity of the market to absorb future transactions. A token might record $200 million in daily volume while its order book holds only $500,000 in genuine resting limit orders within a 2% price band. That discrepancy is not an anomaly. It is the norm for the vast majority of assets outside the top tier by market capitalization.
For US-based investors accustomed to equity markets where institutional market-making provides continuous and relatively deep order flow, this structural difference demands a recalibration of expectations.
Order Book Depth: The Metric That Actually Matters
The most direct measure of executable liquidity is order book depth — specifically, the aggregate volume of resting buy and sell orders within defined price bands above and below the current market price. A well-capitalized, genuinely liquid market will display substantial bid and ask depth at 0.5%, 1%, and 2% increments from the mid-price.
Professional traders evaluate this through a lens called market impact modeling. Before entering or exiting a large position, the relevant question is not "what is the current price?" but rather "at what price will I actually be filled if I need to move $500,000 — or $5 million — in a single session?"
Many exchanges expose order book data through their APIs, and several third-party analytics providers aggregate this information across venues. Examining the depth chart visually is a useful starting point: a steep, narrow shape signals thin liquidity, while a gradual slope extending well beyond the mid-price suggests genuine depth. However, visual inspection alone is insufficient for serious capital deployment.
Slippage Dynamics Under Stress Conditions
Slippage — the difference between the expected execution price and the actual fill price — is the most tangible consequence of inadequate liquidity. Under normal market conditions, slippage on a liquid asset like Bitcoin or Ether may be negligible for retail-scale orders. But conditions change rapidly.
During the March 2020 market dislocation and again during the cascading liquidations of May 2021 and November 2022, order books across numerous assets effectively collapsed. Resting limit orders were pulled by market makers within seconds as volatility breached their risk thresholds. What had appeared to be a liquid market became a one-sided auction, with sellers unable to find buyers at any reasonable price.
This phenomenon — sometimes called a liquidity vacuum — does not require a systemic crisis to materialize. A single large holder exiting a low-cap token, an unexpected negative news event, or even a coordinated social media campaign can drain an order book in minutes. Investors who had sized positions based on average daily volume found themselves holding assets they could not exit without catastrophic slippage.
For US investors specifically, this creates both a financial risk and a tax complexity: forced selling at depressed prices due to illiquidity can trigger unplanned taxable events at the worst possible moment.
Real-World Exit Scenarios: Sizing Positions Against True Liquidity
A practical framework for liquidity assessment begins with a simple question: what percentage of average daily volume does my intended position represent? As a general guideline, professional portfolio managers target positions that represent no more than 1% to 5% of an asset's genuine daily volume — not reported volume, but volume that has been adjusted for suspected wash trading.
Several analytical approaches can help refine this estimate. Comparing volume across multiple exchanges and identifying discrepancies is one method. Examining whether volume spikes correlate with price movement — as genuine demand-driven volume typically does — is another. Assets that display high volume with minimal price impact during apparent buying pressure warrant skepticism.
Beyond position sizing, investors should pre-map their exit strategy before entering a trade. Identifying the liquidity conditions under which a position can be fully liquidated — and the price impact that liquidation would require — transforms risk management from reactive to proactive. This is the analytical discipline that separates precision-oriented investors from those who discover liquidity constraints only when it is too late.
Cross-Venue Liquidity Fragmentation
Another dimension frequently overlooked by individual investors is the fragmentation of liquidity across multiple trading venues. Unlike US equity markets, which benefit from consolidated tape reporting and regulatory best-execution requirements, cryptocurrency markets remain deeply fragmented. The same asset may trade on dozens of centralized exchanges, multiple decentralized protocols, and various derivatives venues simultaneously.
This fragmentation means that aggregate liquidity figures, even when accurate, may not be practically accessible to a single trader. Moving capital across exchanges introduces friction — withdrawal limits, transfer times, and counterparty risk — that can prevent timely execution. During high-volatility periods, exchange withdrawal queues and network congestion can further delay access to capital held on separate platforms.
For investors managing meaningful portfolio allocations, consolidating holdings on regulated, high-liquidity venues and maintaining awareness of cross-venue transfer logistics is a non-negotiable component of sound liquidity risk management.
Building a Liquidity-Aware Portfolio
The practical implication of everything discussed above is straightforward: position size and asset selection should be calibrated to verifiable liquidity, not reported volume. Before allocating to any asset outside the top tier by market capitalization, investors should conduct a structured liquidity audit — examining order book depth, historical slippage data, wash-trading-adjusted volume, and cross-venue accessibility.
This does not mean avoiding less-liquid assets entirely. It means entering them with appropriately sized positions, realistic exit timelines, and contingency plans for stress scenarios. It also means revisiting these assessments regularly, as liquidity conditions in cryptocurrency markets can shift substantially over weeks or months.
At CoinCasso Group, precision in portfolio construction begins with precision in risk assessment. Volume figures make for compelling headlines. Order book depth, slippage modeling, and genuine market impact analysis make for defensible investment decisions. In a market where phantom liquidity is the norm rather than the exception, that distinction is the foundation of durable capital preservation.