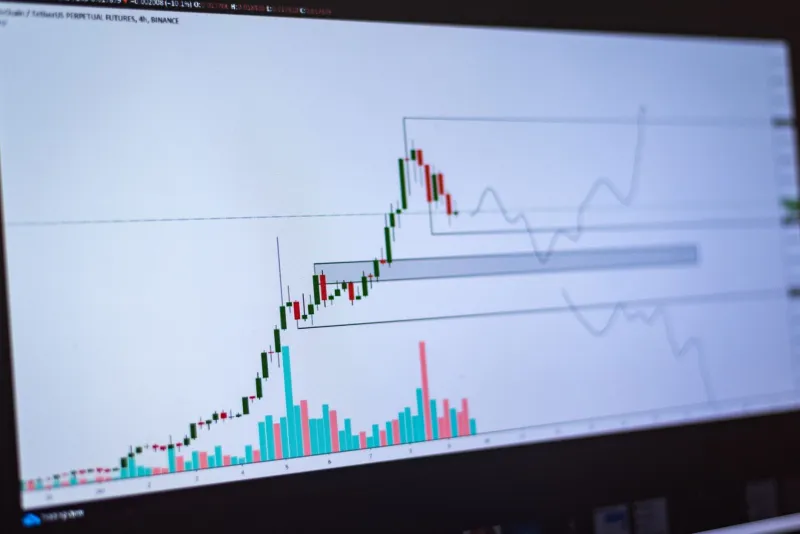
Stop-Loss Geography: How Algorithmic Traders Map Your Exit Points and Profit Before the Real Move Starts
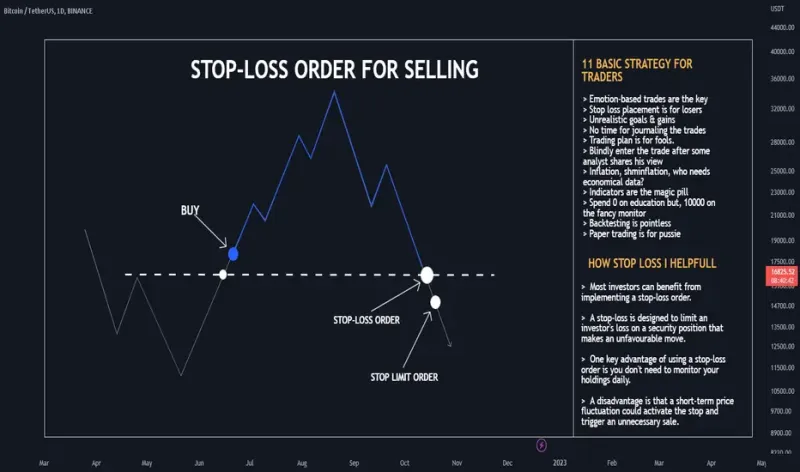
Photo: cryptocurrency order book trading chart stop loss market data, via s3.tradingview.com
Every stop-loss order tells a story. Individually, they represent a trader's personal risk threshold — the price at which they've decided the trade is wrong and capital must be protected. Collectively, they form a map. And that map, visible in varying degrees of resolution to sophisticated market participants, has become one of the most systematically exploited features of modern crypto markets.
Understanding this dynamic is not about paranoia. It is about precision. US traders who continue placing stops at the same levels as everyone else — just below round numbers, just beneath obvious technical support, exactly at the prior swing low — are participating in a predictable ritual that algorithmic systems have been designed to monetize.
How Order Books Reveal Stop Concentration
In liquid crypto markets, the order book is a real-time ledger of buy and sell intentions. What most retail traders don't fully appreciate is that stop-loss orders — particularly on centralized exchanges — are not invisible. While stops themselves sit off the book until triggered, their aggregate effect becomes visible through the behavior of price as it approaches known technical levels.
Market makers and algorithmic trading desks build models that estimate where stop clusters exist based on several inputs: the distance from current price to major round numbers, the location of prior swing highs and lows, the density of visible limit orders just above or below key levels, and open interest distribution on perpetual futures contracts.
This last data point is particularly informative. On exchanges like Binance and Bybit, open interest heat maps and liquidation level data are partially public. A significant concentration of long positions opened at a given price level implies a cluster of stop orders just below it. When that cluster is large enough to be worth targeting, the incentive structure for short-term algorithmic players becomes clear.
The Mechanics of a Stop Sweep
A stop sweep — sometimes called a "stop hunt" in retail trading communities — follows a recognizable sequence. Understanding each stage removes some of its effectiveness.
Stage one: Accumulation. Before a sweep, algorithmic players accumulate a position in the opposite direction of the anticipated stop cascade. This accumulation often occurs during low-volume periods — late US trading hours, early Asian sessions — when thin liquidity allows position building without significant price impact.
Stage two: Pressure toward the cluster. Price is nudged toward the identified stop zone through coordinated selling or buying. This pressure is typically gradual enough to avoid triggering immediate alarm but persistent enough to bring price within range of the stop cluster.
Stage three: The cascade. Once the first stop orders trigger, they generate market orders in the same direction — stop-loss sells in a downward sweep, stop-loss buys in an upward sweep. These market orders move price further, triggering additional stops in a self-reinforcing cascade. The algorithmic player who initiated the pressure is now on the opposite side of a flood of forced market orders, selling their accumulated position into the buying stops or buying into the selling stops at favorable prices.
Stage four: Reversal. After the stop cluster is cleared and the cascade exhausts itself, price frequently reverses sharply. Retail traders who were stopped out watch the market move back in the direction of their original thesis — often within minutes. This is not coincidence. The sweep was not a genuine directional move. It was a liquidity extraction event.
Recognizing the Setup in Real Time
Several observable signals suggest a stop sweep may be imminent rather than a genuine breakout or breakdown.
Declining volume on approach to key levels. Genuine breakouts typically occur on expanding volume. Price approaching a major support or resistance level on declining volume suggests the move is engineered rather than driven by broad market conviction. When volume contracts as price nears a well-known technical level, treat the approach with skepticism.
Funding rate divergence. On perpetual futures markets, funding rates reflect the aggregate sentiment of leveraged participants. A strongly negative funding rate in a downtrend — indicating crowded short positions — paradoxically signals risk of an upward stop sweep targeting short sellers' stop orders above current price. The opposite applies in uptrends with excessively positive funding.
Open interest spikes without price movement. When open interest increases sharply while price consolidates in a tight range, large players are building positions in anticipation of a move. The direction of that anticipated move can sometimes be inferred from which side of the book is absorbing the new contracts.
Round number clustering in liquidation data. Many exchanges now publish estimated liquidation levels for open positions. When a disproportionate number of liquidations are clustered at round-number price points — $60,000, $65,000, $70,000 for Bitcoin — those levels become high-probability targets for short-term price excursions before any sustained directional move.
On-Chain Data as a Stop-Placement Guide
The antidote to predictable stop placement is unpredictable stop placement — and on-chain data provides the raw material for more defensible positioning.
Exchange inflow analysis. Large transfers of assets onto exchanges typically precede selling pressure. Monitoring whale-scale exchange inflows gives retail traders a data-grounded reason to tighten or relocate stops before a potential cascade, rather than waiting for price to approach an obvious technical level.
Realized price by cohort. On-chain analytics platforms track the average acquisition cost of different holder cohorts. Short-term holders' realized price levels — the average cost basis of wallets that have moved coins within the past 155 days — function as natural support and resistance zones that are less publicly visible than chart-based technical levels, making them more defensible for stop placement.
SOPR (Spent Output Profit Ratio). When SOPR readings drop below 1.0, it indicates that the average coin being transacted is being sold at a loss. This often coincides with capitulation events that exhaust selling pressure — a signal that stop-loss orders placed just below current price may be walking into the final flush rather than protecting against a sustained decline.
Repositioning Your Stop-Loss Strategy
The practical takeaway is not to abandon stop-loss orders — position sizing without defined risk limits is its own category of error. The goal is to place stops where they are less predictable and more analytically grounded.
Avoid placing stops at exact round numbers. A stop at $62,400 rather than $62,000 is less likely to be caught in a sweep targeting the obvious cluster. Use volatility-adjusted stop distances rather than fixed pip or percentage distances — ATR-based stops move with market conditions rather than remaining static targets.
Consider time-based stops as a complement to price-based stops. If a trade thesis has not materialized within a defined window, exiting on time rather than price removes the stop from the order book during periods when sweeps are most likely.
Finally, treat the period immediately following a sweep as a potential entry rather than a reason to stay sidelined. When price recovers quickly after piercing a well-known technical level on declining volume, the sweep pattern is confirming the original directional thesis — often with better entry pricing than was available before the engineered dip.
The Informed Participant's Advantage
Stop-loss geography is not a mystery available only to institutional desks. The data required to read it — order book depth, funding rates, open interest distribution, on-chain flow metrics — is accessible to any US trader willing to integrate it into a systematic workflow.
The traders who get swept are those who place stops where everyone else places stops, then interpret the cascade as market wisdom rather than engineered extraction. Recognizing the pattern is the first step toward positioning outside it — and occasionally, toward using it as a signal for the genuine move that follows.